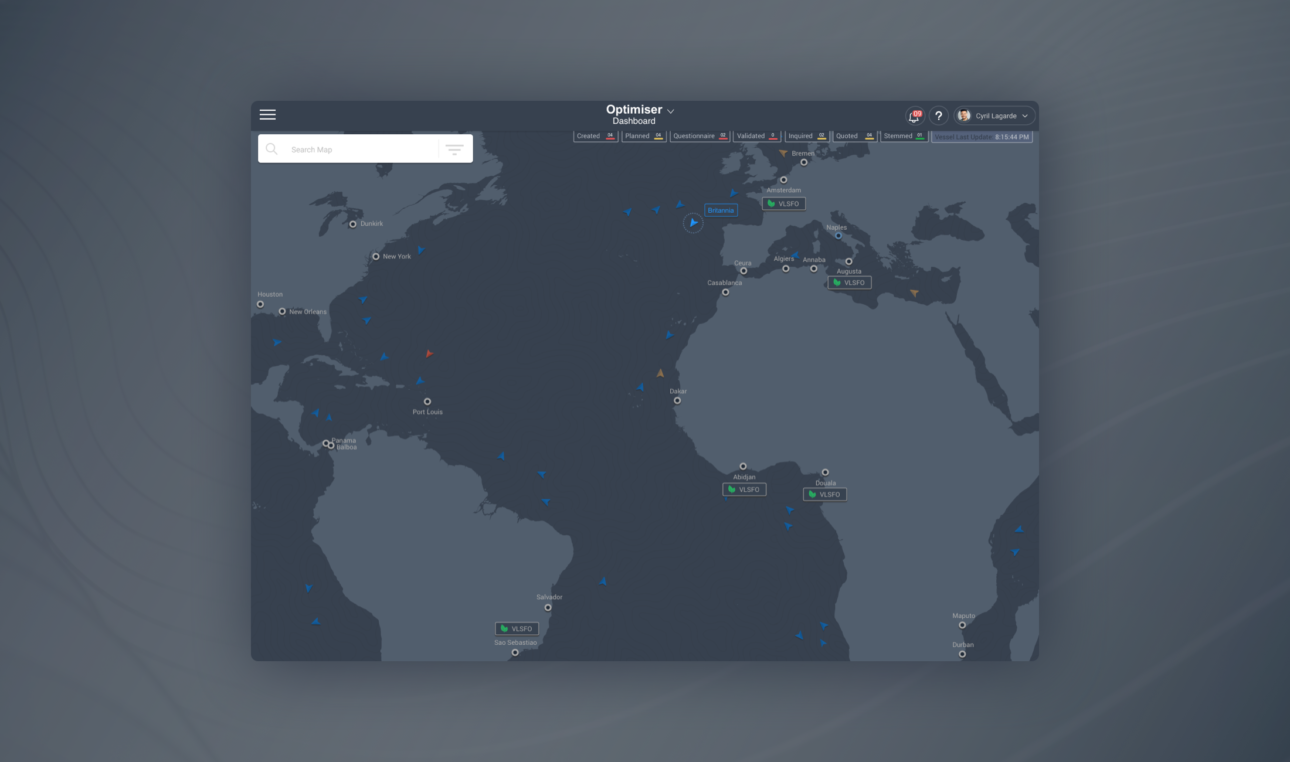
Data Map
for Traders
Execute a complex design oil chart.
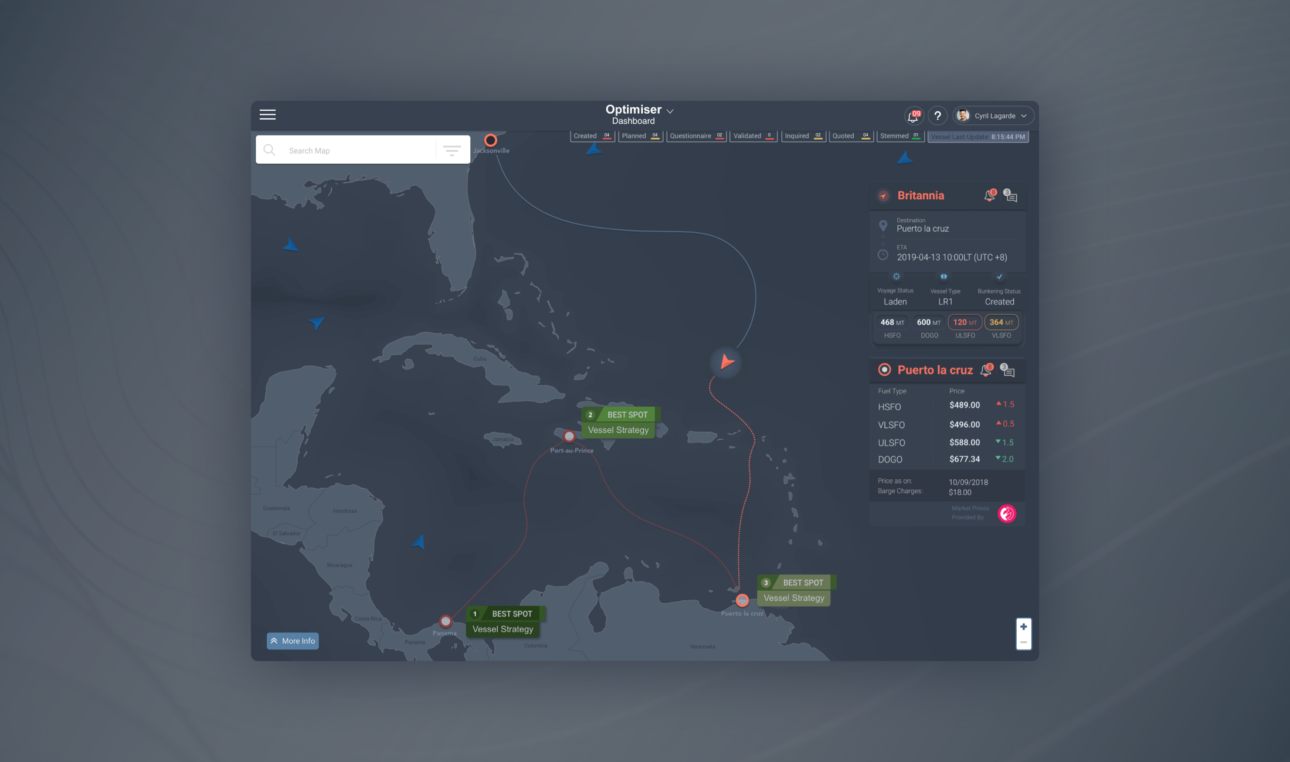
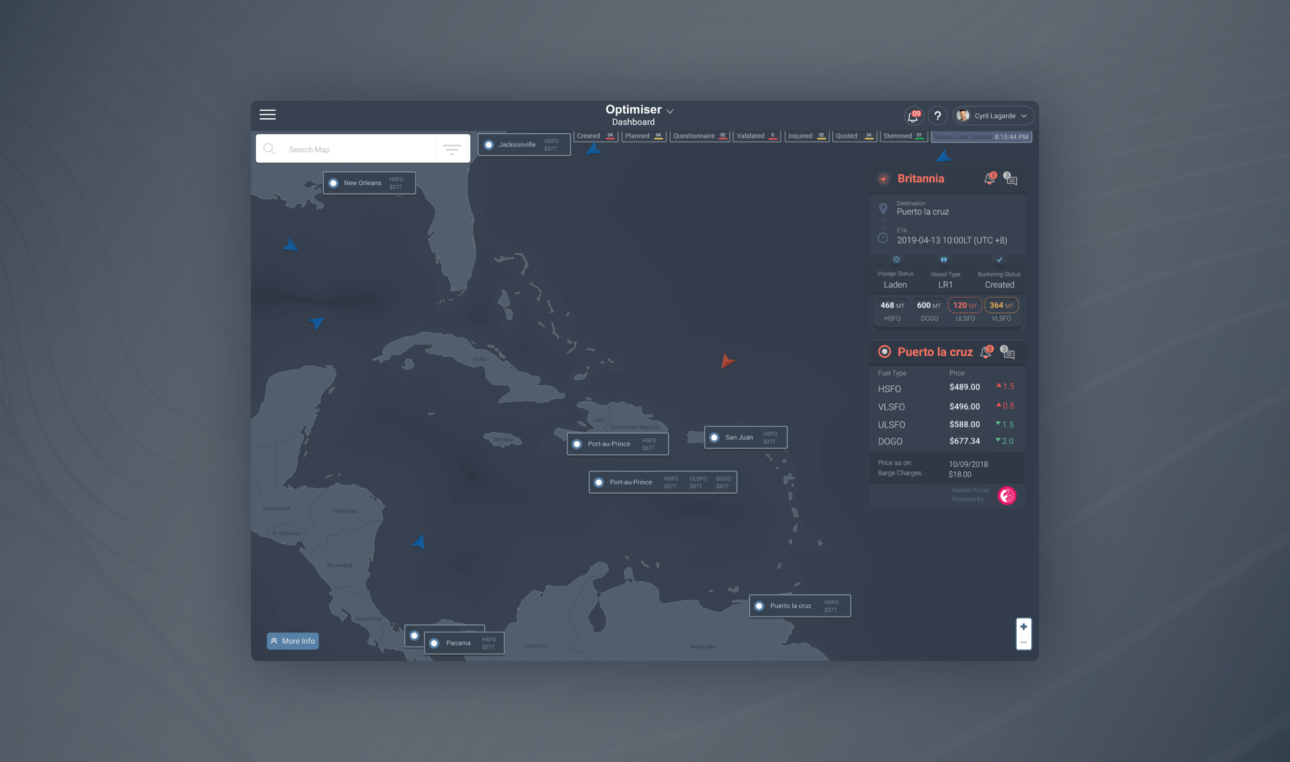
This is an interactive map incorporating features that encourage a high level of engagement, like filtered searches and dynamic route calculation aligned with the current prices benchmarked.
I designed and optimised the user experience and interface visuals of the products and from there, created a shared design library that facilitated a better use of the design resources eliminating duplicate work and design inconsistencies.
Role
Lead User Interface, UX / UI Designer
Discover the Study